
6/16/2014
Calculating the Correct CPI for Your Budget
Categories: Innovation, Strategic Capital Planning, Uncategorized
Every year when budget season arrives, invariably a constituent looks at the proposed budget, performs a thumb-nail analysis and questions why the rate of the proposed spending increase is greater than the Consumer Price Index (rate of inflation).
There are several ways to respond to this inquiry:
- The CPI is an average, calculated on previous years’ figures and so its relevance to a forward looking analysis such as our budget is not appropriate,
- You are correct, our budget does propose a spending increase greater than the CPI, however there are “one time” events that will occur this year which the CPI calculation does not include and so our budget increase is warranted, or
- All CPI’s are not equal. You may be using an inappropriate CPI figure. For example there is a national CPI and a CPI which characterizes our regional economy and if you perform the correct analysis, you will determine that our budget does reasonably fall in line with the Consumer Price Index.
All of the above positions are to some degree reasonable. However, experience has taught us that the best way to “counter” an argument, especially in a public forum, is not to debate the premise of the point being made. Doing so, leads the questioner and more importantly others present with the impression, that the underlying point of the question remains unanswered and therefore must be correct. Rather, the best way to answer the inquiry is to assume the premise of the question is correct for the moment, noting this assumption in your response and refuting the facts. Response No. 3 achieves this desired result. Now for the details………
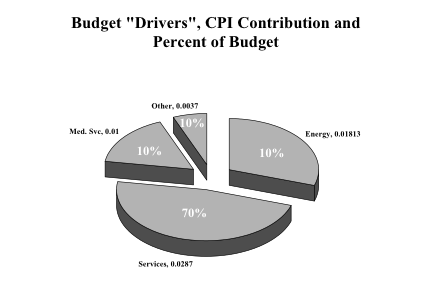
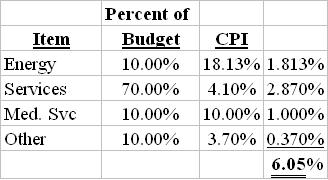
The most relevant CPI information available for us to use is the New York-Northern New Jersey-Long Island Area data. However, simply selecting the overall Consumer Price Index for this area will provide a misleading result. We recommend that clients determine the main “drivers” of their budget in terms of overall costs, including what percent of the total budget each constitutes, find the correlating CPI for each category and develop a weighted-average, which will serve as the most reasonable Consumer Price Index to use as a benchmark for their proposed budget. For example, in the past we have used “Services”, “Energy”, “Medical Services” and “Other” as main budget drivers. Note in the example cited, that “Energy” constitutes only 10% of budget dollars to be expended, yet given an annual inflation (CPI) of 18.13%, poses the second strongest impact on the total derived CPI. Furthermore, the derived CPI is 6.05% compared with the overall CPI for the region of 2.7%.
So the next time budget season “rolls around”, be prepared to answer the CPI question using this methodology. 
Back to Top