
4/27/2015
Yield Curve- 101
Categories: Bond Trends, Municipal Debt
If you are a municipal debt issuer and want to achieve the best borrowing value, your financial advisor should be talking to you about the Yield Curve when they advise you about issuing your Bonds. The below case is one example how under certain market conditions, savings might be achieved.
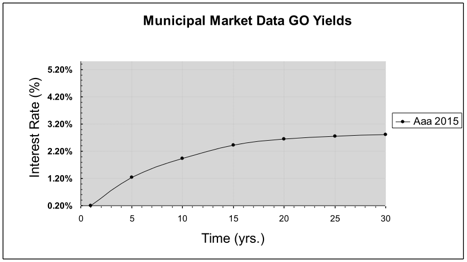
The Yield Curve is an industry standard chart which publishes what interest rates are being charged for specific durations of time (See chart below). It is also an indicator of market conditions. Generally speaking, the longer the duration of your borrowing, the higher the interest rate.
For the past several years we have been encouraging our municipal clients to keep the maturity of their Bonds as short as budget constraints allow. Why? Due to a relatively steep yield curve borrowers were paying historically higher interest rates for every additional year they borrowed, therefore those issuers who could shorten their maturities were getting a better value.
As of the date of this article, we are starting to encourage our municipal clients to extend the maturity of their Bonds, as the opposite is happening. The Yield Curve is getting less steep or “flattening,” therefore Bond issuers are being charged historically less interest for every additional year they now borrow.
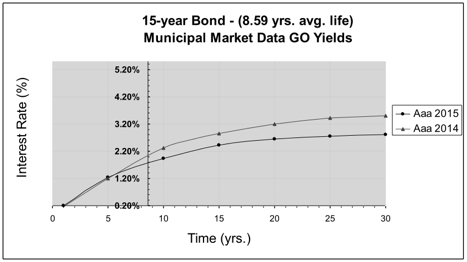
For example, last April (2014) a Aaa rated issuer who sold a 15-year Bond (average life of 8.59 years) could expect to pay a net interest rate of 2.05%. Today that same Bond would carry a 1.80% net rate, a $63,000 savings in interest, based on a $3.0 mil. Bond. Therefore, the 15-year Bond is now a better value. (See chart below)
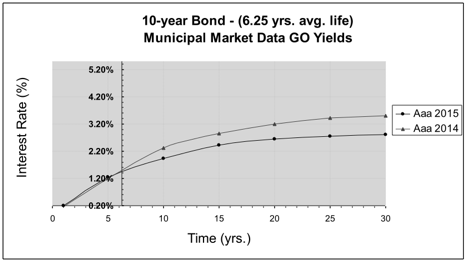
In comparison, the 10-year rate is essentially unchanged. The value decision is neutral. (See chart below)
…and so for borrowing value, think Yield Curve the next time you are issuing a Bond and call us for assistance.
Back to Top